My Settings page will provide you with an easy method of making configurations to sections of SYCLE that would impact only on your own experience within application. The following selections/changes can be made using this page.
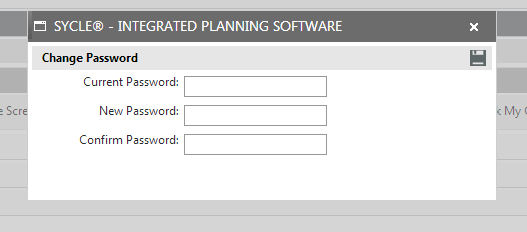
You can change your password using this section. To do so;
STEP 1: Click "Change Password."
STEP 2: Enter your current password.
STEP 3: Enter new password and confirm new password
STEP 4: Click Save icon.
Settings section would allow you to personalise different areas in the system as per your requirement.
This is a collapsible section which would require you to set your default homepage for different modules.
NOTE: - some of the homepage options would be activated upon purchasing the corresponding module along with SYCLE.
a) Homepage options for Planning and Metrics module: My Quick Update, My Performance and Executive Intelligence.
b) Homepage options for Projects and Program Management module: Project Register, Project Hub (Project Discussions, Change Request, Project Quick Update, Project Activities, Project History, Project Schedule, Project Dashboards and Project Actual Budget), Project Quick Update (My Projects, My Project Tasks, My Project Risks, My Project Risk Actions, My Project Risk Controls, My Issues, My Issue Actions, My Issue Decisions and My Approvals).
c) Homepage options for Risk Management module: My Quick Update, Risk Register (Strategic Risk Register, Operational Risk Register, Project Risk Register and Control Register), Executive Intelligence, Risk Analysis, Audit and Incident.
Here, you can select the sections that you prefer to be visible in the quick update page and define whether a section should be collapsed/expanded by default. Following sections are available for configuration.
NOTE: only products which you have purchased will be displayed.
This section will enable user to configure the visibility of Quick Update options for Project and Program Management.
This is a collapsible section which displays a grid with the following information when expanded. This section will enable you to configure the visibility of project elements and set the default page for the Project Hub.

You can see the customisable system alerts for Actions, KPIs and Budgets that require your attention in collapsible grids. You can customise your thresholds for when you want to be alerted for Actions, Budgets and KPIs.
Action Exception - can define the exception value for action, in order to trigger the alert when the action progress is less than the given value.
Budget Exception Percentage - can define the exception value for expenditure/budget of the action, in order to trigger the alert when the YTD expenditure is equal to the given value or more than the YTD budget. You may enter the threshold value as a %. Please contact your Administrator for more information.
KPI Exception - can define the exception value for KPI, to trigger the alert when the performance is less than the given value.
You can create a list of reports which you frequently use as your favourite reports by selecting the reports from the left side panel by clicking the plus icon. Once the report is selected it will be added to the list shown on the right side panel (if you wish to remove a report from the list, of reports you have selected, you can click on the minus icon against the specific report).
These reports will be displayed in 'My Reports' page.
The following settings are included under this section:
Risk Graph
Select the default Risk Graph (Static/Interactive) to be displayed in the EIS Risk section.
Interactive - KPI graph with interactivity, newly introduced.
KPI Graph
Select the default KPI Graph type (Static/Interactive) to be displayed in the KPI area in EIS.
Interactive - KPI graph with interactivity, newly introduced.
In the static graph, you can select the period of the data by defining the dates in the 'From' and 'To' boxes. When you view the chart for a cumulative KPI, you will have 'Display Normal' tick-box to switch the chart to normal view. Likewise, when you view the chart for a normal KPI, you would have 'Display Cumulative' tick-box to switch the chart to cumulative view.
If you are using the interactive KPI graphs, you have following options to change the chart display.
Button to Hide/Show legend
Dropdown to change the chart type (Line/Column/Bar/Area)
Dropdown to change the background theme of the chart
Within this section, you can edit existing personal discussion groups or create a new one.
Create a new Personal Discussion Group
STEP 1: In order to create a new discussion group, click on 'New' icon.

Type the name and click 'Save'. You will be able to add users only after saving.
STEP 2: More fields will be displayed after saving.
Filter by Organisation Link: can filter by Organisation linkage
Linked Project: can filter by Project linkage
Use the aforesaid filters to narrow your user search.
You can also locate a user by performing a keyword search on his/her name. Type the user's name in 'Name' text box below 'Filter by Organisation Link' field and press Enter.
Click on 'Select All' tick box to select all displayed users.
STEP 3: Once selections are completed, click 'Add' button.
Member names will appear with an option to 'Delete' if required.
STEP 4: Click Save to complete creation.
Modify an Existing Personal Discussion Group
Click on the 'Edit' icon next to a group name. Details will be displayed. You can change group name, add new members or delete existing members as shown above.
Click 'Save' once modified.
Copyright © 2014-2015 CAMMS Online Help. All rights reserved.
Last revised: November 26, 2017