The Overview tab summarises performance information across actions, performance indicators, budgets and risks for a particular period and hierarchy level.
According to default settings, it shows data for the current year and last closed period* (this is shown within the period view) and the organisation level which you are linked. However, you can make a selection by using the reporting year dropdown lists at the top of the page and the hierarchy tree control available on the left side of the panel.
It also triggers you alerts for items that are off track based on your personalised thresholds.
Three performance donut charts and a line chart are shown at the top for a ‘bird’s eye’ view of your Action, KPI, Budget and Risk performance respectively.
Action Performance: This donut graph will give you the performance of all actions within the particular hierarchy node and filtered date period. The performance is calculated based on the period targets and YTD actual.
KPI Performance: This donut graph will give you all KPIs linked to a particular hierarchy level.
Currently, KPIs with no target set (nothing saved at all against targets/actuals tab) will not be displayed in EIS.
Performance will be based on the period view target and actual. Note: KPIs are all setup differently and calculation methods, periods and aggregation will impact KPI results.
For example (few different types of KPIs):
Annual KPIs will only show at the end of the reporting year.
KPIs which have an aggregation of cumulative/average will show a cumulative/average result accordingly.
See KPIs section for more information on how different KPIs are calculated as per the way they have been setup.
Budget Summary: This graph will show the Budget vs Actual of all the actions linked at a particular hierarchy node, against the period view.
|
|
The Budget graph can be configured to display either income, expenditure, or both budget types. Refer following 'Alert Setting' section for further information. |
Risk Summary: This graph will show the risks which are linked to a given hierarchy node. This area will be available only if you are using Risk Management, along with SYCLE.
When you click on a coloured section of the donut chart, you would be able to see a detailed grid with the list of Actions/KPIs/budget/Risks contributed to the performance indicated by that colour.
This interface can be used to configure the visualisations of both action performance and KPI performance donut charts.
Action donut chart can be filtered for default filter options using the filtrations listed in 'Configure Action Summary Chart'. Selected filter options will be displayed beneath the chart itself. EIS administrator can configure budget summary chart in a way that, end user see either cumulative/period figures. Moreover, he/she can also selects the type of budget, either both income and expenditure, income only or expenditure only to be displayed within the chart.
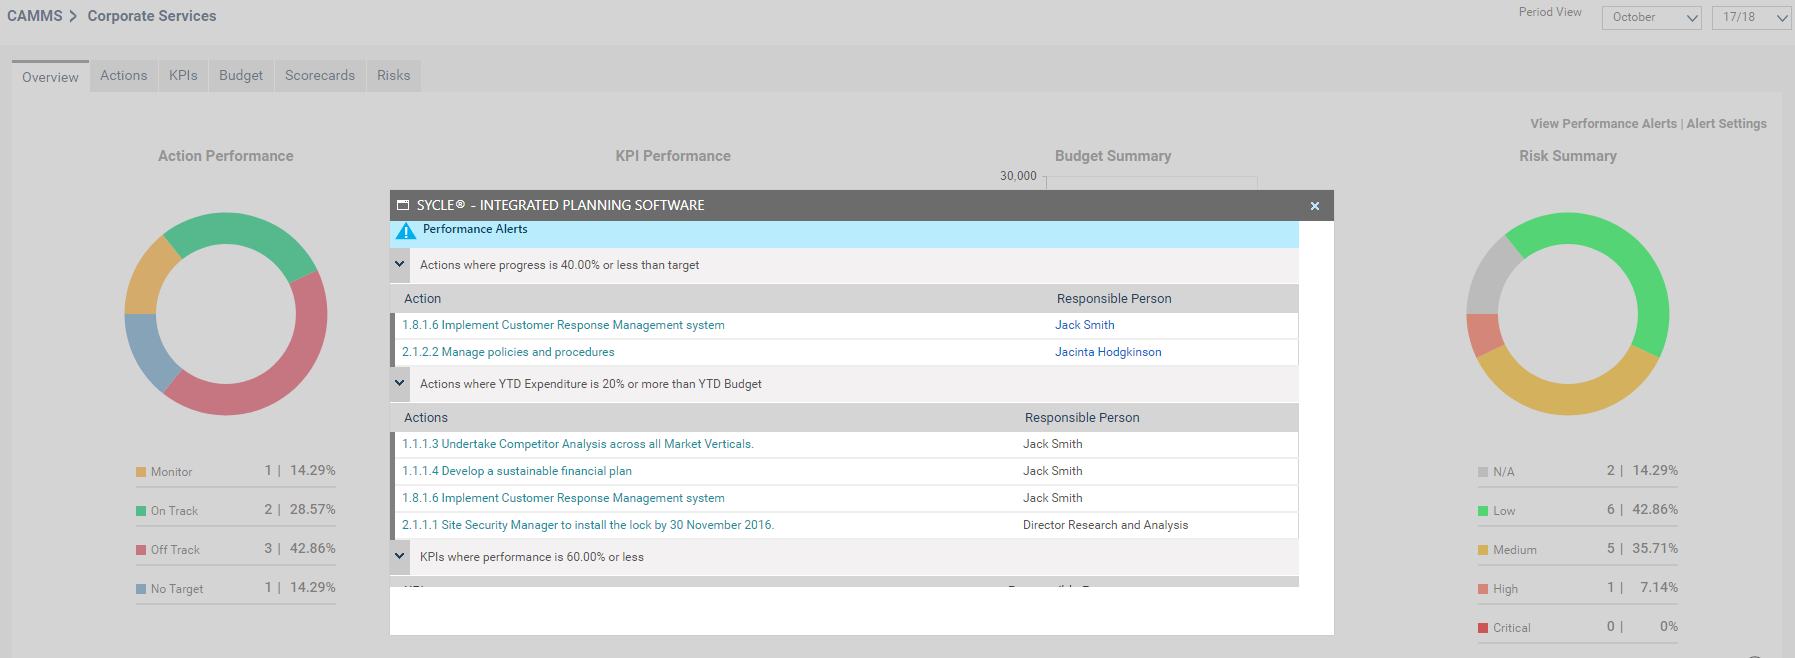
You can see the customisable system alerts for Actions, KPIs and Budgets that require your attention in collapsible grids. You can customise your thresholds for when you want to be alerted for Actions, Budgets and KPIs via 'My Settings>EIS Settings' area.
Action Exception - can define the exception value for action, in order to trigger the alert when the action progress is less than the given value.
Budget Exception Percentage - can define the exception value for expenditure/budget of the action, in order to trigger the alert when the YTD expenditure is equal to the given value or more than the YTD budget. You may enter the threshold value as a %. Please contact your Administrator for more information.
KPI Exception - can define the exception value for KPI, to trigger the alert when the performance is less than the given value.
Alerts can be viewed from 'View Performance Alerts' popup window.
Copyright © 2014-2015 CAMMS Online Help. All rights reserved.
Last revised: November 26, 2017
