STEP 1: Select the Reporting Year.
STEP 2: Select the Directorate.
STEP 3: Select the Business Unit.
STEP 4: Click 'Preview' to view an Adobe Acrobat document of the report via the browser. Use 'Change' to revert to the criteria specification form.
STEP 5: Click 'Export' to generate the report in the selected file type. After the report is generated, a browser message window pops up.
STEP 6: Click 'Open' to open the document or 'Save' to save the document in the PC.
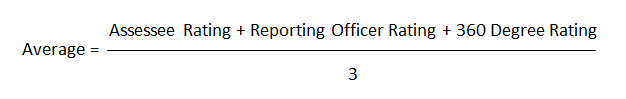
All Scores are based on the average of all ratings. The average is calculated using the following formula.
Score Comparison: This shows the comparison of the Average Scores (by Business Unit) for the current reporting period that the report is generated, and the last 4 years.
Scoring Elements Performance: This shows the Average Scoring of all staff (within the reporting filters) for the current period that the report is generated. The trend compares to the previous year scores.
Top Performers Business Units: This shows the Business Units with the top average scores based on the thresholds. The upper threshold is all scores more than or equal to an average rating of 3.5.
Under Performers Business Units: This shows the Business Units with the low average scores based on the thresholds. The lower threshold is all scores less than or equal to 2 an average rating of 2.
Directorate Top Performers: This shows the Staff top performers within the Directorate selected based on the thresholds. The upper threshold is all scores more than or equal to an average rating of 3.5.
Directorate Under Performers: This shows the Staff under performers within the Directorate selected based on the thresholds. The lower threshold is all scores less than or equal to an average rating of 2.
Business Unit Top Performers: This shows the staff top performers within the Business Unit selected based on the thresholds. The upper threshold is all scores more than or equal to an average rating of 3.5.
Business Unit Under Performers: This shows the staff under performers within the Business Unit selected based on the thresholds. The lower threshold is all scores less than or equal to 2 an average rating of 2.
Competency Strengths: This shows the Competency scores average based on the top performing competencies within the competency element (for the entire organisation or depending on the filters applied). The upper threshold is all scores more than or equal to an average rating of 3.5.
Competency Gaps: This shows the Competencies scores based on the under performing competencies element (for the entire organisation or depending on the filters applied). The lower threshold is all scores less than or equal to 2 an average rating of 2.
 |
The report determines which Business Unit or Directorate the staff member is attached to via the Organisation Link. Therefore, make sure that all staff members are setup within the correct Business Unit or Directorate to ensure they are displayed within the correct group in the report. |
Copyright © 2014-2015 CAMMS Online Help. All rights reserved.
Last revised: November 26, 2017