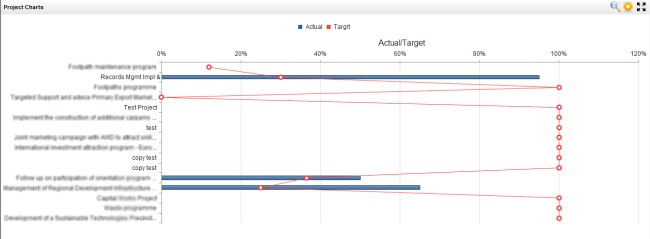
The Project Chart View will display a chart view of all the Organisation Projects.
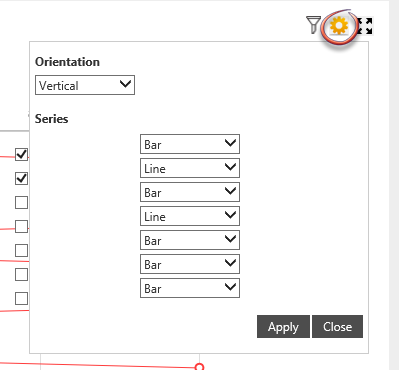
You can click on the 'Cog wheel' icon on right top corner next to the search icon in order to configure different orientations for the visibility of the chart.
You can click on the 'Filter' icon and refine the criteria in order to filter the data as required.
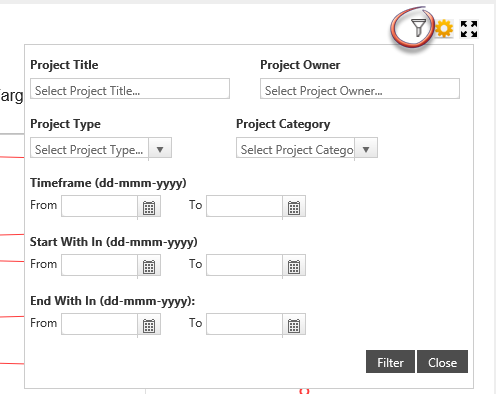
The filters of the search box is as below:
| Project Title | Search as per the project title. This box has auto fill facility which will enable you to locate the project conveniently. |
| Project Owner | Search as per the project owner. This box has auto fill facility which will enable you to locate the project owner conveniently. |
| Project Type | The dropdown will enable you to choose the project type. |
| Project Category | The dropdown will enable you to choose the project category. |
| Time Frame | Can search using the time frame in which the project falls into. |
| Start With in | Can search by using a range of dates to locate the start date of the project. |
| End With in | Can search by using a range of dates in which the end date of a project falls into. |
Note: Limitations when viewing the graph.
The graph cannot display both Target/Actual for progress as well as your YTD Budget and Actual on the same graph because the scales for the parameters for each item are different.
For example, the X Axis on the top of the graph is showing the Target/Actual % (and doesn’t actually show these values on the graph because the scale has been blown out for the X Axis of the Budget (at the bottom). Hence, there is a large YTD Budget and Actual. You will only be able to view the YTD Budgets on a separate graph to the Projects Target and Actual.
Copyright © 2014-2015 CAMMS Online Help. All rights reserved.
Last revised: November 26, 2017