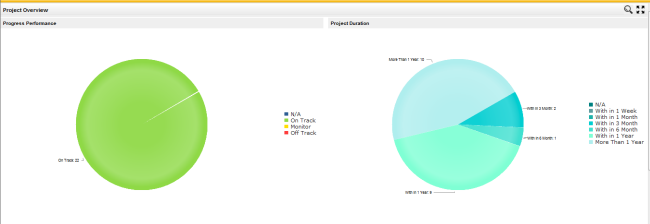
The overview area provides a "snapshot view" of project performance in the form of four pie charts; one each for project progress, project expenditure, duration and total effort as shown below:
The information shown will be based on the search criteria chosen by you within Framework> Project Settings area.
When you hover above a particular section, it will display the number which is indicated by that share,
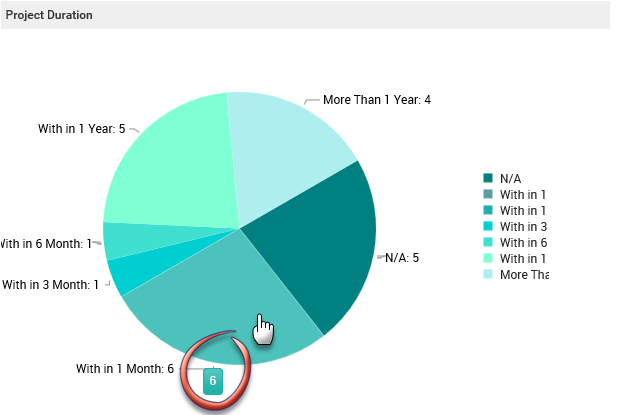
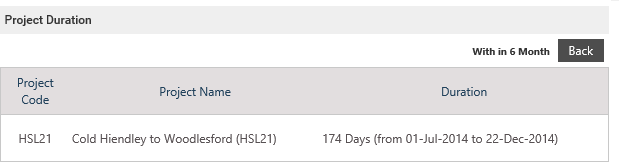
When you click on a particular section (i.e clicking the section which indicates the 'N/A' in project cost will open a table indicating the projects with N/A cost with columns such as Project code, Project Name and Cost) of the Pie chart, a table indicating the summary view will appear. Click on the 'Back' button to navigate back to the Pie chart view.
Below is an example of a summary which will appear when you click a particular section of the pie chart.
The below table provides an insight to each of the Pie charts.
|
Progress Performance |
This Pie chart Indicates the overall progress of the organisations' projects categorised as 'On Track, Off Track, Monitor and N/A. Clicking a section of the pie chart will display a detailed view indicating project code, name, project owner and start/end date. |
|
Project duration |
This Pie chart displays the duration of all the organisation projects. Duration range is based on overall start and end dates of the projects such as 'within 1 week, within 1 month, 3 months' etc. Clicking on a section of the pie chart will display a detailed view indicating the projects which falls during the selected duration (project code, project name, start and end date with the total duration is indicated) |
|
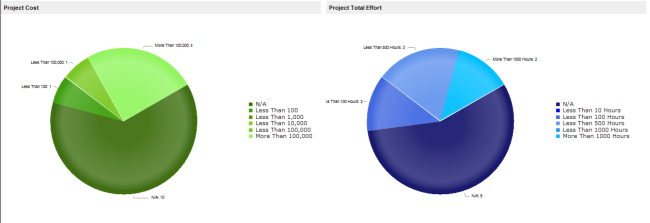
Project Cost |
This Pie chart indicates the total expenditure of all projects. The values are obtained from ‘Expenditure’ section in preliminary budget object. Clicking a section will display the projects which fall under the particular expenditure range. Project code, name and total expenditure is displayed in the detailed view. |
|
Project Total Effort |
This Pie chart indicates the total efforts for overall projects. Clicking a section will give a detailed view of projects which falls under the particular range. Project code, name and total effort is indicated. |
You can use the 'Filter' option given on top right corner in order to refine the information which you wish to be displayed. Simply click on the 'Search' button and the below screen will appear.
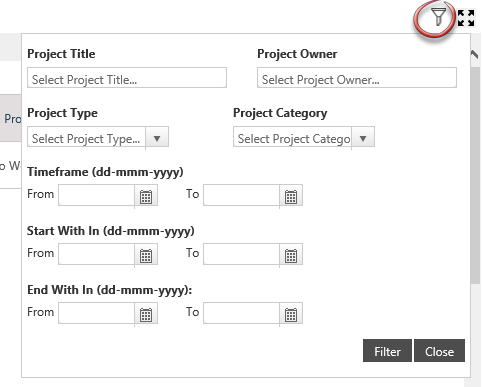
Below table gives an overview of the search criteria,
|
Project Title |
Search as per the project title. This box has auto fill facility which will enable you to locate the project conveniently. |
|
Project Owner |
Search as per the project owner. This box has auto fill facility which will enable you to locate the project owner conveniently. |
|
Project Type |
The dropdown will enable you to choose the project type. |
|
Project Category |
The dropdown will enable you to choose the project category. |
|
Time Frame |
Can search using the time frame in which the project falls into. |
|
Start With in |
Can search by using a range of dates to locate the start date of the project. |
|
End With in |
Can search by using a range of dates in which the end date of a project falls into. |
Copyright © 2014-2015 CAMMS Online Help. All rights reserved.
Last revised: November 26, 2017