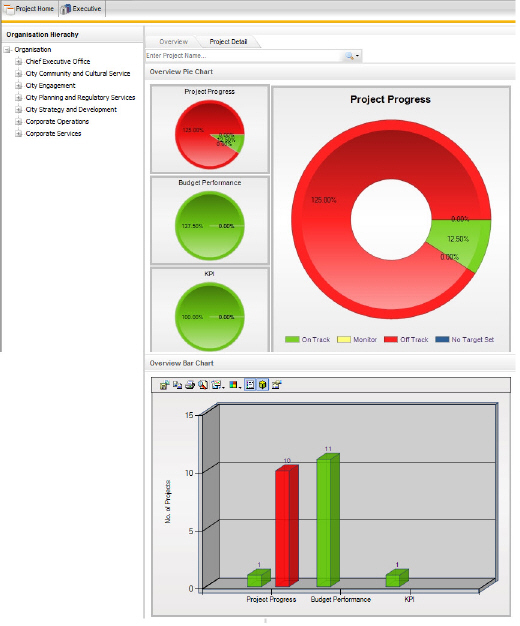
The Overview area provides a "snapshot view" of project performance in the form of three pie charts; one each for project progress, budget performance and KPIs.
STEP 1: Click on any of the smaller performance pie charts to view the larger version in the centre. Default 'Project Progress' pie chart will be displayed.
STEP 2: Click the pie chart (e.g. Project Performance) to view the sub levels.
Similarly, you can view the sub levels of budget and KPIs.
Use the organisation tab on the left to filter project performance based on the organisational hierarchy or use the filters provided at the top.
Legend
|
Colour |
Description |
|
Blue |
Projects without targets defined (does not apply for Budgets/KPIs) |
|
Green |
On Track |
|
Amber |
Monitor |
|
Red |
Off Track |
STEP 3: Select the 'Project Details' tab to view the summarised details of the projects for a selected hierarchy.
Project view will display all the projects within the system, grouped by project. Organisation view will display the same information, only grouped by the organisational hierarchy.
Legend
|
Icon |
Description |
|
|
Project Progress - On Track |
|
|
Project Progress - Off Track |
|
|
Budget - On Track |
|
|
Budget - Off Track |
|
|
Project targets are not defined |
Copyright © 2014-2015 CAMMS Online Help. All rights reserved.
Last revised: November 26, 2017