Widgets that can be used with KPI Data – Charting - Bar charts, Bar and Line charts and Donut,
Gauges- Speedometer & Thermometer,
Grids -Scorecard control and Map control.
Basic Properties
Option is available in all widgets to change the size and rename the chart to your preference.
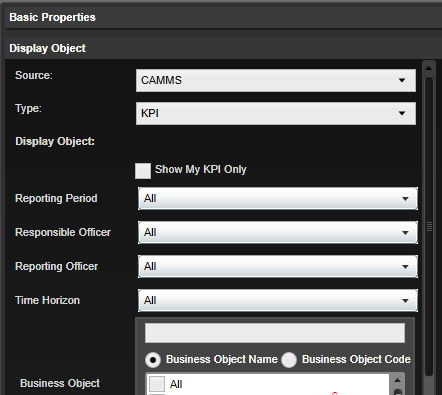
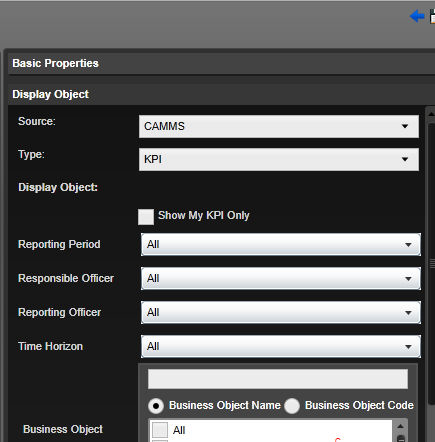
Display Objects
Following display objects are available for KPI Data in Bar chart control.
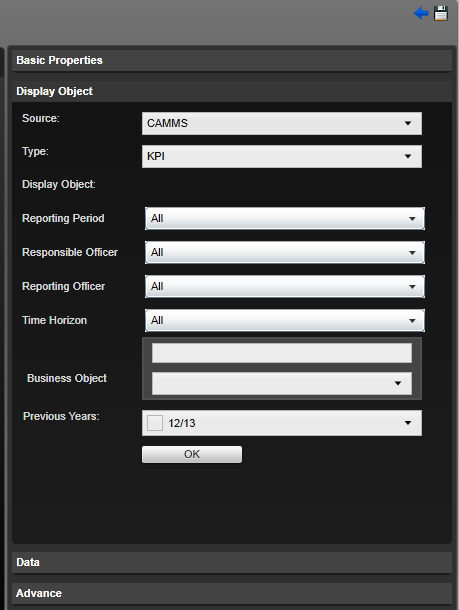
Display Object
|
Object Name |
Description |
|
|
Reporting Period |
Defines the reporting period. |
|
|
Option |
Description |
|
|
All |
Select this to display data belonging to all reporting periods. |
|
|
Annual |
Select this to display annual KPI data. |
|
|
Half Year |
Select this to display biannual KPI data. |
|
|
Month |
Select this to display monthly KPI data. |
|
|
Quarter |
Select this to display quarterly KPI data. |
|
|
Week |
Select this to display weekly KPI data. |
|
|
Reporting Officer |
Defines the reporting officer. Based on the selection, data is filtered |
|
|
Responsible Officer |
Defines the responsible officer. |
|
|
Time Horizon |
Defines the reporting method. |
|
|
Option |
Description |
|
|
All |
Select this to display all data. |
|
|
Period |
Select this to display periodical data. |
|
|
YTD |
Select this to display Year-To-Date data. |
|
|
Business Object |
Defines the business objects that are displayed within the widget. Select the KPI that needs to be displayed from the drop down. The system uses the following indicators in red colour superscript to depict the type of KPI. C - Calculated KPI T - Trend KPI R - Rollup KPI CT - Calculated Trend KPI No indicator - Normal KPI Enter the name of the KPI in the text field above to quickly retrieve it. |
|
|
Measurement |
Select the measurement type. This option is only available for Gauges and Data Grids. The Charting widget does not have this option. |
|
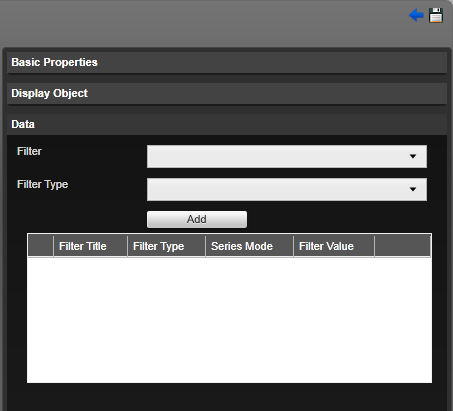
Data Filters
Following data filters are available for KPI Data in bar chart control.
|
Data Type |
Possible Filter types |
|
Year |
Filter (Filter display data for the selected year. Dropdown would list out the financial years from 2000 to 2070) |
|
Actual |
Data Column |
|
Target |
Data Column |
|
Period |
X axis, Filter (Dropdown would list out all months), Series |
|
Common Period |
Filter (Display data for a set of common periods provided (ex - YTD, All 2012 2013, Year to June 2013, Year to May 2013 etc)) |
|
Period Actual |
Data Column |
|
Period Target |
Data Column |
|
Period |
X axis, Filter (Dropdown would list out all months), Series |
|
Min Target |
Min Target (only applicable for Gauges, will not display for Charts ) |
|
Max Target |
Max Target (only applicable for Gauges, will not display for Charts ) |
|
Performance |
Data Column |
|
KPI Trend |
Indicator (Only applicable for scorecards and will not be displayed for charts) |
|
KPI Status |
Indicator (Only applicable for scorecards and will not be displayed for charts) |
|
Title |
Label |
|
Data Range |
Filter |
|
Previous Year Target |
Data Column |
|
Previous Year Period Target |
Data Column |
|
Previous Year Actual |
Data Column |
|
Previous Year Actual Target |
Data Column |
|
Previous Year Performance |
Data Column |
|
Previous Year Status |
Data Column |
|
Previous Year trend |
Data Column |
|
|
- If the selected KPI does not have at least two pairs of Actual & Targets (or in the case of Trend KPIs, a pair of Actuals) an error message will be displayed 'Don’t have enough data to populate scorecard'. - In chart widget, by default the x-axis will contain the Period (defined in the corresponding KPI). The y-axis will contain the target/actual values. - The filter will be selected as ‘Year’ by default with the current financial year selected and displaying all available data for that year. - The default Data Columns is ‘Actual’ and ‘Target’ (for trend KPIs, ‘Target’ will not appear). |
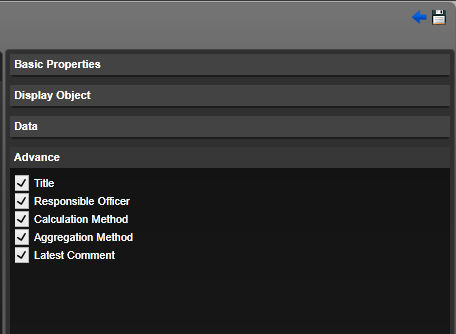
Advanced Options
Following Advanced options are available for KPI's in Bar chart control.
|
Property Name |
Description |
|
Title |
Tick the check box to display the title of the business object being displayed. |
|
Responsible Officer |
Check this to display the responsible officer. |
|
Calculation Method |
Check this to display the calculation method. |
|
Aggregation Method |
Check this to display the aggregation method. |
|
Latest Comment |
Check this to display the last comment set in the system for this KPI. For Bar Charts, the latest comment within the selected period will be shown here |
Bar & line Charts
Display Object
Same Display objects are available as mentioned above.
|
Object Name |
Description |
|
|
Reporting Period |
Defines the reporting period. |
|
|
Option |
Description |
|
|
All |
Select this to display data belonging to all reporting periods. |
|
|
Annual |
Select this to display annual KPI data. |
|
|
Half Year |
Select this to display biannual KPI data. |
|
|
Month |
Select this to display monthly KPI data. |
|
|
Quarter |
Select this to display quarterly KPI data. |
|
|
Week |
Select this to display weekly KPI data. |
|
|
Reporting Officer |
Defines the reporting officer. Based on the selection, data is filtered |
|
|
Responsible Officer |
Defines the responsible officer. |
|
|
Time Horizon |
Defines the reporting method. |
|
|
Option |
Description |
|
|
All |
Select this to display all data. |
|
|
Period |
Select this to display periodical data. |
|
|
YTD |
Select this to display Year-To-Date data. |
|
|
Business Object |
Defines the business objects that are displayed within the widget. Select the KPI that needs to be displayed from the drop down. The system uses the following indicators in red colour superscript to depict the type of KPI. C - Calculated KPI T - Trend KPI R - Rollup KPI CT - Calculated Trend KPI No indicator - Normal KPI Enter the name of the KPI in the text field above to quickly retrieve it. |
|
|
Measurement |
Select the measurement type. This option is only available for Gauges and Data Grids. The Charting widget does not have this option. |
|
Data Filters
Following data filters are available for KPIs in bar chart control.
|
Data Type |
Possible Filter types |
|
Year |
Filter (Filter display data for the selected year. Dropdown would list out the financial years from 2000 to 2070) |
|
Actual |
Data Column |
|
Target |
Data Column |
|
Period |
X axis, Filter (Dropdown would list out all months), Series |
|
Common Period |
Filter (Display data for a set of common periods provided (ex - YTD, All 2012 2013, Year to June 2013, Year to May 2013 etc)) |
|
Period Actual |
Data Column |
|
Period Target |
Data Column |
|
Period |
X axis, Filter (Dropdown would list out all months), Series |
|
Min Target |
Min Target (only applicable for Gauges, will not display for Charts ) |
|
Max Target |
Max Target (only applicable for Gauges, will not display for Charts ) |
|
Performance |
Data Column |
|
KPI Trend |
Indicator (Only applicable for scorecards and will not be displayed for charts) |
|
KPI Status |
Indicator (Only applicable for scorecards and will not be displayed for charts) |
|
Title |
Label |
|
Data Range |
Filter |
|
Previous Year Target |
Data Column |
|
Previous Year Period Target |
Data Column |
|
Previous Year Actual |
Data Column |
|
Previous Year Actual Target |
Data Column |
|
Previous Year Performance |
Data Column |
|
Previous Year Status |
Data Column |
|
Previous Year trend |
Data Column |
|
|
- If the selected KPI does not have at least two pairs of Actual & Targets (or in the case of Trend KPIs, a pair of Actuals) an error message will be displayed 'Don’t have enough data to populate scorecard'. - In chart widget, by default the x-axis will contain the Period (defined in the corresponding KPI). The y-axis will contain the target/actual values. - The filter will be selected as ‘Year’ by default with the current financial year selected and displaying all available data for that year. - The default Data Columns is ‘Actual’ and ‘Target’ (for trend KPIs, ‘Target’ will not appear). |
Advanced Options
Following Advanced options are available for KPIs
|
Property Name |
Description |
|
Title |
Tick the check box to display the title of the business object being displayed. |
|
Responsible Officer |
Check this to display the responsible officer. |
|
Calculation Method |
Check this to display the calculation method. |
|
Aggregation Method |
Check this to display the aggregation method. |
|
Latest Comment |
Check this to display the last comment set in the system for this KPI. For Bar Charts, the latest comment within the selected period will be shown here |
Donut controls for KPI's
Display object
|
Object Name |
Description |
|
|
Show My KPI Only |
Tick this check box to filter out the KPI data that is relevant to the user. This option is only available for Gauges and Data Grids. The Charting widget does not have this option except in Donut control. |
|
|
Reporting Period |
Defines the reporting period. |
|
|
Option |
Description |
|
|
All |
Select this to display data belonging to all reporting periods. |
|
|
Annual |
Select this to display annual KPI data. |
|
|
Half Year |
Select this to display biannual KPI data. |
|
|
Month |
Select this to display monthly KPI data. |
|
|
Quarter |
Select this to display quarterly KPI data. |
|
|
Week |
Select this to display weekly KPI data. |
|
|
Reporting Officer |
Defines the reporting officer. Based on the selection, data is filtered |
|
|
Responsible Officer |
Defines the responsible officer. |
|
|
Time Horizon |
Defines the reporting method. |
|
|
Option |
Description |
|
|
All |
Select this to display all data. |
|
|
Period |
Select this to display periodical data. |
|
|
YTD |
Select this to display Year-To-Date data. |
|
|
Business Object |
Defines the business objects that are displayed within the widget. Select the KPI that needs to be displayed from the drop down. The system uses the following indicators in red colour superscript to depict the type of KPI. C - Calculated KPI T - Trend KPI R - Rollup KPI CT - Calculated Trend KPI No indicator - Normal KPI Enter the name of the KPI in the text field above to quickly retrieve it. |
|
|
Measurement |
Select the measurement type. This option is only available for Gauges and Data Grids. The Charting widget does not have this option. |
|
Data Filters
Following data filters are available for KPIs in bar chart control.
|
Data Type |
Possible Filter types |
|
Year |
Filter (Filter display data for the selected year. Dropdown would list out the financial years from 2000 to 2070) |
|
Actual |
Data Column |
|
Target |
Data Column |
|
Period |
X axis, Filter (Dropdown would list out all months), Series |
|
Common Period |
Filter (Display data for a set of common periods provided (ex - YTD, All 2012 2013, Year to June 2013, Year to May 2013 etc)) |
|
Period Actual |
Data Column |
|
Period Target |
Data Column |
|
Period |
X axis, Filter (Dropdown would list out all months), Series |
|
Min Target |
Min Target (only applicable for Gauges, will not display for Charts ) |
|
Max Target |
Max Target (only applicable for Gauges, will not display for Charts ) |
|
Performance |
Data Column |
|
KPI Trend |
Indicator (Only applicable for scorecards and will not be displayed for charts) |
|
KPI Status |
Indicator (Only applicable for scorecards and will not be displayed for charts) |
|
Title |
Label |
|
Data Range |
Filter |
|
Previous Year Target |
Data Column |
|
Previous Year Period Target |
Data Column |
|
Previous Year Actual |
Data Column |
|
Previous Year Actual Target |
Data Column |
|
Previous Year Performance |
Data Column |
|
Previous Year Status |
Data Column |
|
Previous Year trend |
Data Column |
|
|
- If the selected KPI does not have at least two pairs of Actual & Targets (or in the case of Trend KPIs, a pair of Actuals) an error message will be displayed 'Don’t have enough data to populate scorecard'. - In chart widget, by default the x-axis will contain the Period (defined in the corresponding KPI). The y-axis will contain the target/actual values. - The filter will be selected as ‘Year’ by default with the current financial year selected and displaying all available data for that year. - The default Data Columns is ‘Actual’ and ‘Target’ (for trend KPIs, ‘Target’ will not appear). |
Advanced Options
Following Advanced options are available for KPIs
|
Property Name |
Description |
|
Title |
Tick the check box to display the title of the business object being displayed. |
|
Responsible Officer |
Check this to display the responsible officer. |
|
Calculation Method |
Check this to display the calculation method. |
|
Aggregation Method |
Check this to display the aggregation method. |
|
Latest Comment |
Check this to display the last comment set in the system for this KPI. For Bar Charts, the latest comment within the selected period will be shown here |
Gauge Controls
Speedometer(Gauge)
Following basic Properties are available for KPI data in Gauge control. The Title and size also can be changed
Display Objects
Following display objects are available for KPI Data in Speedometer (Gauge) control.
|
Object Name |
Description |
|
|
Show My KPI Only |
Tick this check box to filter out the KPI data that is relevant to the user. This option is only available for Gauges and Data Grids. The Charting widget does not have this option except in Donut control. |
|
|
Reporting Period |
Defines the reporting period. |
|
|
Option |
Description |
|
|
All |
Select this to display data belonging to all reporting periods. |
|
|
Annual |
Select this to display annual KPI data. |
|
|
Half Year |
Select this to display biannual KPI data. |
|
|
Month |
Select this to display monthly KPI data. |
|
|
Quarter |
Select this to display quarterly KPI data. |
|
|
Week |
Select this to display weekly KPI data. |
|
|
Reporting Officer |
Defines the reporting officer. Based on the selection, data is filtered |
|
|
Responsible Officer |
Defines the responsible officer. |
|
|
Time Horizon |
Defines the reporting method. |
|
|
Option |
Description |
|
|
All |
Select this to display all data. |
|
|
Period |
Select this to display periodical data. |
|
|
YTD |
Select this to display Year-To-Date data. |
|
|
Business Object |
Defines the business objects that are displayed within the widget. Select the KPI that needs to be displayed from the drop down. The system uses the following indicators in red colour superscript to depict the type of KPI. C - Calculated KPI T - Trend KPI R - Rollup KPI CT - Calculated Trend KPI No indicator - Normal KPI Enter the name of the KPI in the text field above to quickly retrieve it. |
|
|
Measurement |
Select the measurement type. This option is only available for Gauges and Data Grids. The Charting widget does not have this option. |
|
Data Filters and Advanced Options are same as the above mentioned.
Linear Gauge control (Thermometer)
Display objects, Data Filters and Advanced Options are same as the above mentioned.
Data Grids
Scorecard control
Following basic properties are available.
Display objects
Same as above discussed.
Data Filters and Advanced Options are same as the above mentioned.
Map Control
Basic Properties
Hierarchy properties
GIS Hierarchy
Hierarchy Tree
Display object
Following display objects are available.
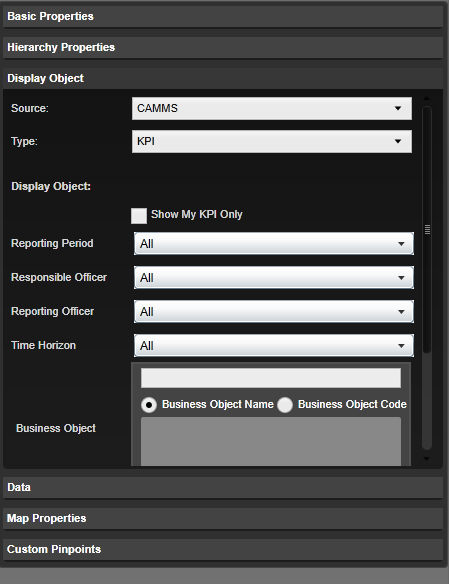
Data filters
Same as above mentioned.
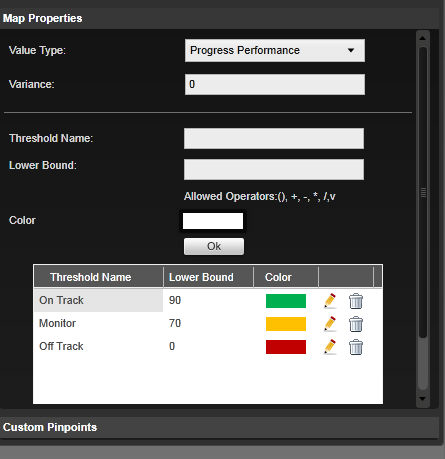
Map Properties
|
Value Type |
|
|
Variance |
|
|
Threshold name |
|
|
Lower Bound |
|
|
Colour |
Can be used to indicate the performance Green - On Track Amber - Monitor Red - Off Track |
Custom Points
Following pinpoint are available.
Copyright © 2014-2015 CAMMS Online Help. All rights reserved.
Last revised: November 26, 2017
