Display Objects
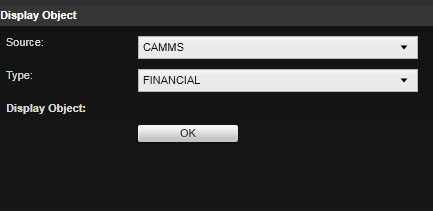
To display Financial data in a Bar or Bar and line chart widgets, simply select Financial as type and click ‘OK’.
Following display objects are available for Financial data.
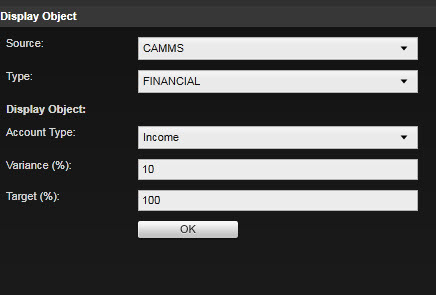
When displaying Financial Data in a gauge, you would have the following filter options.
|
Property Name |
Description |
|
Account Type |
Select whether to display income or expenditure accounts |
|
Variance and Target % |
Defines the variance and target percentage These fields are used to plot the gauge’s scale. lease refer the Business rules to see the performance calculation. |
Data Filters
Following data filters are available for Finance data.
|
Data Type |
Possible Filter types |
Available in |
Displayed by default in |
Description/ Notes |
|
Year |
Filter (Bar, Bar and Line), X axis(Bar and Line) |
Bar, Bar and Line |
Bar and Line (Filter type - Filter, Value - 'Current Year') |
Filter dropdown would display financial years from 2000 to 2070. |
|
Period |
Filter (Bar, Bar and Line), X axis (Bar and Line) |
Bar, Bar and Line, Gauge |
Bar and Line(Filter type - Filter, Value - 'All') Gauge (Value - All) |
Filter dropdown would display all months in the calendar. |
|
Organisation Unit |
Filter (Bar, Bar and Line) |
Bar, Bar and Line, Gauge
|
Bar and Line (Filter type - Filter, Value - 'All') Gauge (Value - Organisation) |
Filter dropdown would display all levels of the organisation hierarchy (from Organisation, Business Unit and Service Profile, its Directorates through to Actions) |
|
YTD Actual |
Data Column (Bar, Bar and Line) |
Bar, Bar and Line
|
Bar and Line (Filter type - Data Column, Value - 'Income') |
N/A |
|
YTD Budget |
Data Column (Bar, Bar and Line) |
Bar, Bar and Line
|
Bar and Line (Filter type - Data Column, Value - 'Income') |
N/A |
|
Action |
Filter (Bar, Bar and Line) |
Bar, Bar and Line
|
|
Filter dropdown would display all action and would allow users to view the figures for a particular action |
|
Account type |
Filter (Bar, Bar and Line), X axis, Series (Bar and Line) |
Bar, Bar and Line
|
Filter dropdown would display Income and Expenditure. This would allow users to decide whether budget values displayed are Income or Expenditure (if YTD Actual, YTD Budget, etc. are selected as Data Columns in the chart) ‘Series’ should be used when users want the account type to be represented as data columns in the chart |
|
|
Budget type |
X axis (Bar, Bar and Line) |
Bar, Bar and Line |
N/A |
|
|
YTD Variance |
Data Column (Bar, Bar and Line) |
Bar, Bar and Line |
N/A |
|
|
YTD % Variance |
Data Column (Bar, Bar and Line) |
Bar, Bar and Line |
N/A |
|
|
Period Actual |
Data Column (Bar, Bar and Line) |
Bar, Bar and Line |
N/A |
|
|
Period Budget |
Data Column (Bar, Bar and Line) |
Bar, Bar and Line |
N/A |
|
|
Period Variance |
Data Column (Bar, Bar and Line) |
Bar, Bar and Line |
N/A |
|
|
Period % Variance |
Data Column (Bar, Bar and Line) |
Bar, Bar and Line |
N/A |
|
|
Financial Year |
Gauge |
Gauge (Value - Current year) |
N/A |
|
|
During financial integration, accounts that are added to planning area will be mapped to an organisation unit. However not all accounts may be mapped to an organisation unit. To include unmapped accounts you should tick 'Include unmapped accounts' tick box that is displayed for the 'Organisation' filter. If this is ticked, the chart displayed will include accounts that are not mapped to a specific organisation unit. If unchecked, it will exclude unmapped accounts when displaying the chart. |
Advanced Options
Advanced options are not available for Financial data.
Copyright © 2014-2015 CAMMS Online Help. All rights reserved.
Last revised: November 26, 2017
