The ability to view and analyse Action and Task information within relevant Power Data widgets – Donut, Gauge and Data Grid.
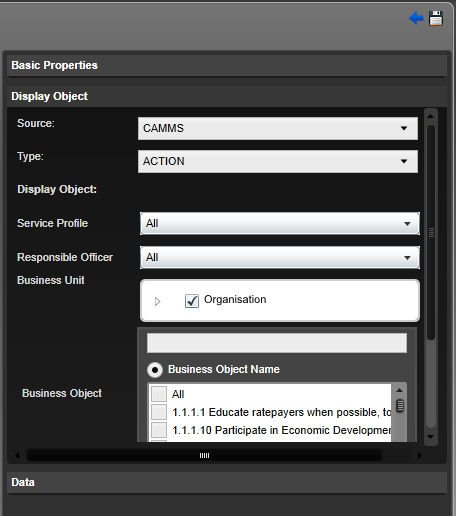
Enable users to load and view the progress of actions within the Donut control. To enable this drag and drop the widgets in Dashboard area and select edit option in the widget. Select the Type as Action.
Basic Properties
Option is available to change the size and rename the chart to your preference. This is common to charting, gauges and Data grid widgets.
Display Objects
Following display objects are available for Actions. Once the user selects the required options and click ‘Ok’, it Displays the preview.
| Object Name | Description |
| Service Profile |
Defines the service profile.
|
| Responsible officer |
Defines the responsible officer.
|
| Business unit |
This filter contains an organisation hierarchy tree, where users can traverse and select one or more Business units. Selecting a higher level (e.g. Directorate or Organisation) will automatically select all its child units. By default all are selected |
| Data filter | filters are explained in the below table. |
|
Property Name |
Description |
|
Business Object |
Define action/s. Lists out all actions within the selected business units. |
|
Measurement |
Select the measurement type (e.g.performance). This option is only available for Gauges. |
Data Filters
Following data filters are available for Actions.
|
Data Type |
Possible Filter types |
Available in |
Displayed by default in |
Description/ Notes |
|
Period |
Filter (Data grid, Gauge) |
Gauge |
|
N/A |
|
Common Period |
Filter (Data grid, Gauge, Donut) |
Data grid, Gauge, Donut |
Data grid (Filter type - 'Filter' , Value - 'YTD') Gauge (Filter type: Filter, Value: YTD) |
Filter dropdown would display data for a set of common periods provided (ex - YTD, All 2012 2013, Year to June 2013, Year to May 2013 etc) |
|
Performance |
Data Column (Data grid), performance (Gauge) |
Data grid, Gauge
|
Data grid (Filter type - 'data column). Gauge (Filter Type - performance) |
Performance is calculated as follows; Performance = (Actual/Target) * 100 |
|
Variance |
Data Column (Data grid) |
Data grid
|
Data grid (Default type - 'data column |
Variance is calculated as follows; Variance = YTD Budget – YTD Actual |
|
Progress |
Data Column (Data grid) |
Data grid
|
Data grid (Default type- 'Data Column , value- 'Income') |
Displays traffic lights to indicate whether the relevant action is on-track (green), off-track (red) or monitor (yellow) Performance <= Lower Threshold then it’s Off-Track Upper Threshold > Performance > Lower Threshold then it’s Monitor Performance >= Upper Threshold then it’s On-Track Note: the Upper and Lower Thresholds used above is determined by the per user setting configured in EIS Settings area. If this is not set, the global organisation threshold setting is used. |
|
Budget |
Indicator (Data grid) |
Data grid
|
Data grid (Default type - 'indicator) |
Displays traffic lights to indicate whether the relevant action is on-track (green), off-track (red) or monitor (yellow) Variance < Lower Threshold then it’s Off-Track Upper Threshold >=Variance>= Lower Threshold then it’s Monitor Variance> Upper Threshold then it’s On-Track Note: the Upper and Lower Thresholds used above is determined by the per user setting configured in EIS Settings area. If this is not set, the global organisation threshold setting is used. |
|
Business Unit |
Filter (Data grid, Donut) |
Data grid, Gauge, Donut
|
|
N/A
|
|
Status |
Series (Donut) |
Donut |
|
N/A |
Charting Controls
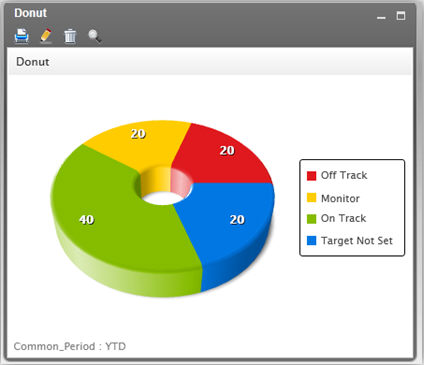
Donut control
Only Donut control can be used to load actions
The donut shows the percentage of selected actions which belong to each progress status.
The colours used in the donut must be: Red (Off-Track), Green (On-Track), Yellow (Monitor) and Blue (No Targets Set).
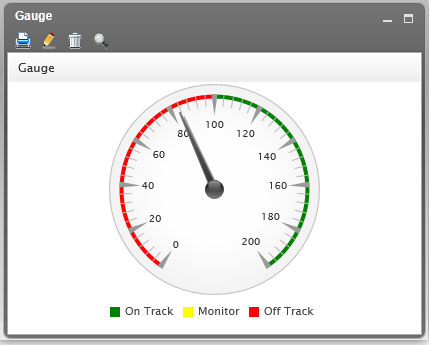
Gauge Controls
Enable users to load and view the performance of actions within the Gauge controls. Loading Actions (created in Sycle/interplan) as its data source.
Only Speedometer(Gauge) widget can be used to load actions.
The scale of the gauge is mapped according to the Upper and Lower Thresholds configured in EIS Settings area (note: this will be the per-user setting, or if not set the global organisation setting is used):
Off Track is less than or equal to Lower Threshold
Monitor is between Lower Threshold and Upper Threshold
On Track is more than or equal to Upper Threshold
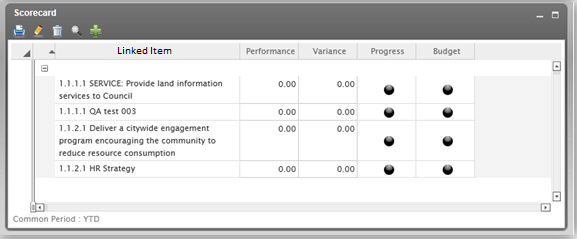
Data Grid control
Only Scorecard widget is capable of loading Actions/Tasks.
Enable users to load and view the status of Actions within the Data Grid control.
|
|
- The following filter elements displayed in Gauge, do not contain any filter types (since they are not applicable for Gauges) Status, Progress, Budget, Variance - The following filter elements displayed in Donut, are not applicable and therefore, selecting them will not have any impact on the chart. Performance, Variance, Progress, Budget
|
Advanced Options
Advanced options are not available for Actions.
Copyright © 2014-2015 CAMMS Online Help. All rights reserved.
Last revised: November 26, 2017
