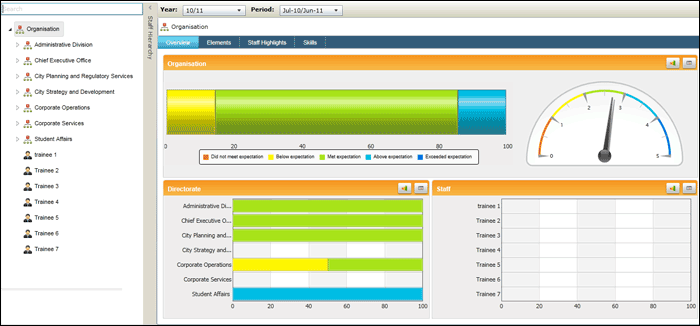
The system defaults to the Overview tab when 'Analysis Services' is accessed. This provides overall summaries relevant to the current user's hierarchy level for the selected reporting year.
Use the search option in 'Staff Hierarchy' slide-in pane to quickly locate an individual staff member, Business Unit or a Directorate. When a hierarchy level is selected, the system displays the corresponding analytical view of the assessments for that level.
The system uses the reporting year and the evaluation period criteria to filter the data.
Use 'Year:' drop down to select the reporting year. Select the evaluation period from 'Period:' drop down.
The system displays the underlying data values of gauges or pipe charts as you hover over a section.
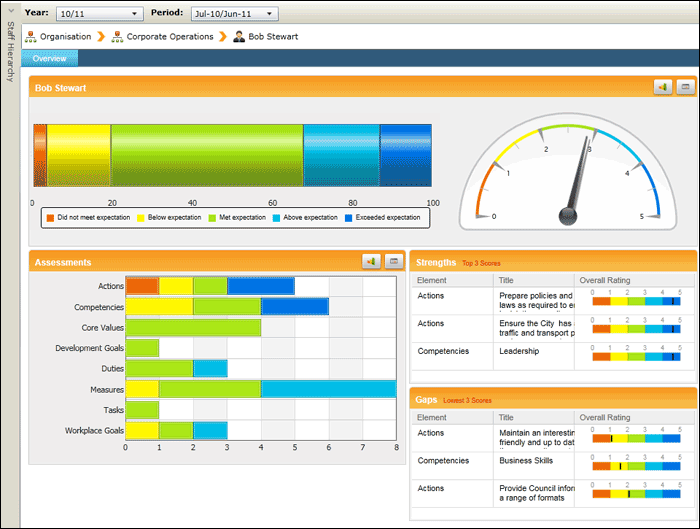
Below screen sample displays the performance overview of the entire organisation.
The gauge on the right displays the average score of the assessments for the selected hierarchy level. Hover over the gauge pointer to view the average score.
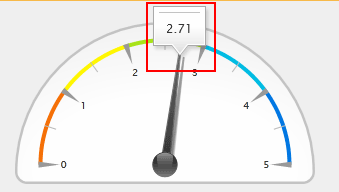
According to the above screen sample, the average assessments score for the entire organisation is 2.71.
Use the following button controls to change the view of the display components.
|
Button Control |
Description |
|
Pipe Chart View |
Display the data in pipe chart form. The pipe chart is "clickable" allowing you to drill down to the lowest level of the hierarchy and view performance information. |
|
Grid View |
Display the data in a grid. This view does not allow drilling down. |
At the bottom-left of the page, the breakdown of the overall performance is displayed. This view may change according to the Analysis Services Business Rules. For instance, the below image is the view which the Chairperson of organisation sees when accessing Analysis Services. This is a very high level analytical view displaying the performance of each Directorate of the organisation. Similarly, Directors get a breakdown of the performance of the Business Units attached to that Directorate and Business Unit Managers get a view displaying the breakdown of the performance of each staff member attached to that Business Unit.
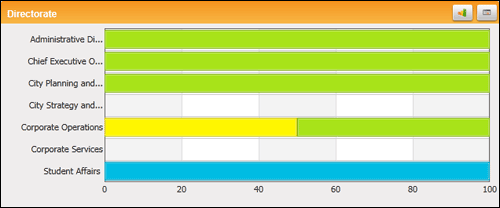
Click on any of the pipe charts to view the breakdown of the that selected business entity's performance. Below screen image displays performance of a Directorate.
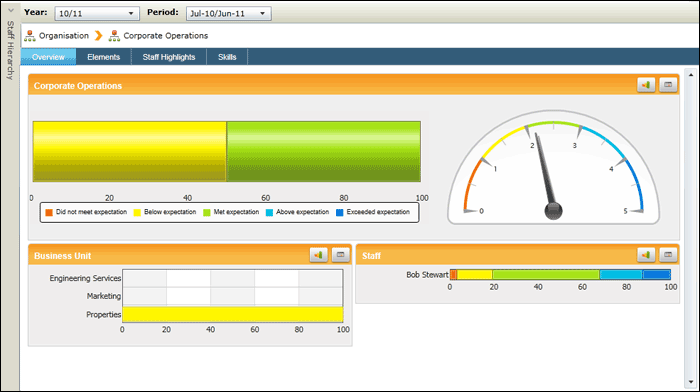
Similarly, by clicking on the pipe chart of a Business Unit, you can view the breakdown of performance for the business unit.
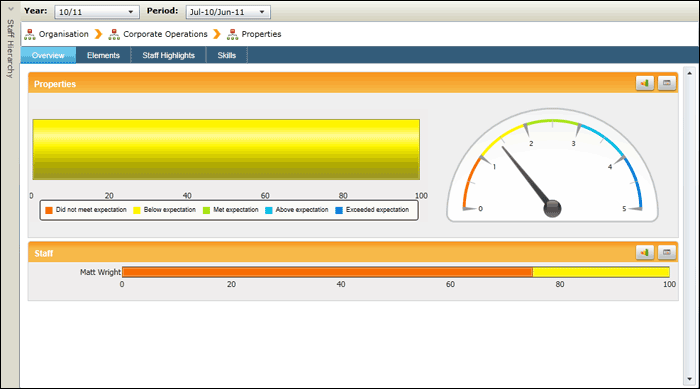
At the Business Unit level, the system displays the overall performance of the business unit and breakdown of staff performance. Click on the pipe chart to view the individual performance of the staff member.
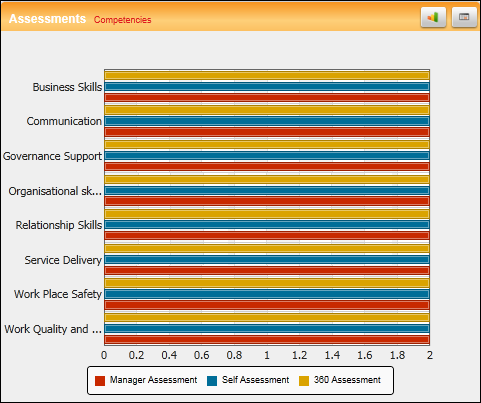
You can further drill down to view the assessment information of the elements. Click on a pipe chart belonging to an element. The system displays the breakdown of the assessment of that element.
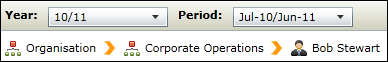
The hierarchy level of the current view is displayed as a bread crumb trail at the top below the Year selection. This can be used to quickly navigate upwards in the organisational hierarchy after drilling down.
Copyright © 2014-2015 CAMMS Online Help. All rights reserved.
Last revised: November 26, 2017