
- Action performance will display the current performance based on last closed period targets.
- KPI performance (YTD) will display the last closed period's performance.
My Performance page is one of the homepage options available and it's one of the easiest ways to view your performance in terms of actions and KPIs in a graphical presentation. This displays the data that belongs to the current reporting year only. This area can be accessed either from mega menu workspace area or side bar.
Two donut chart are used to represent data relevant to your Action Performance and KPI Performance.
|
|
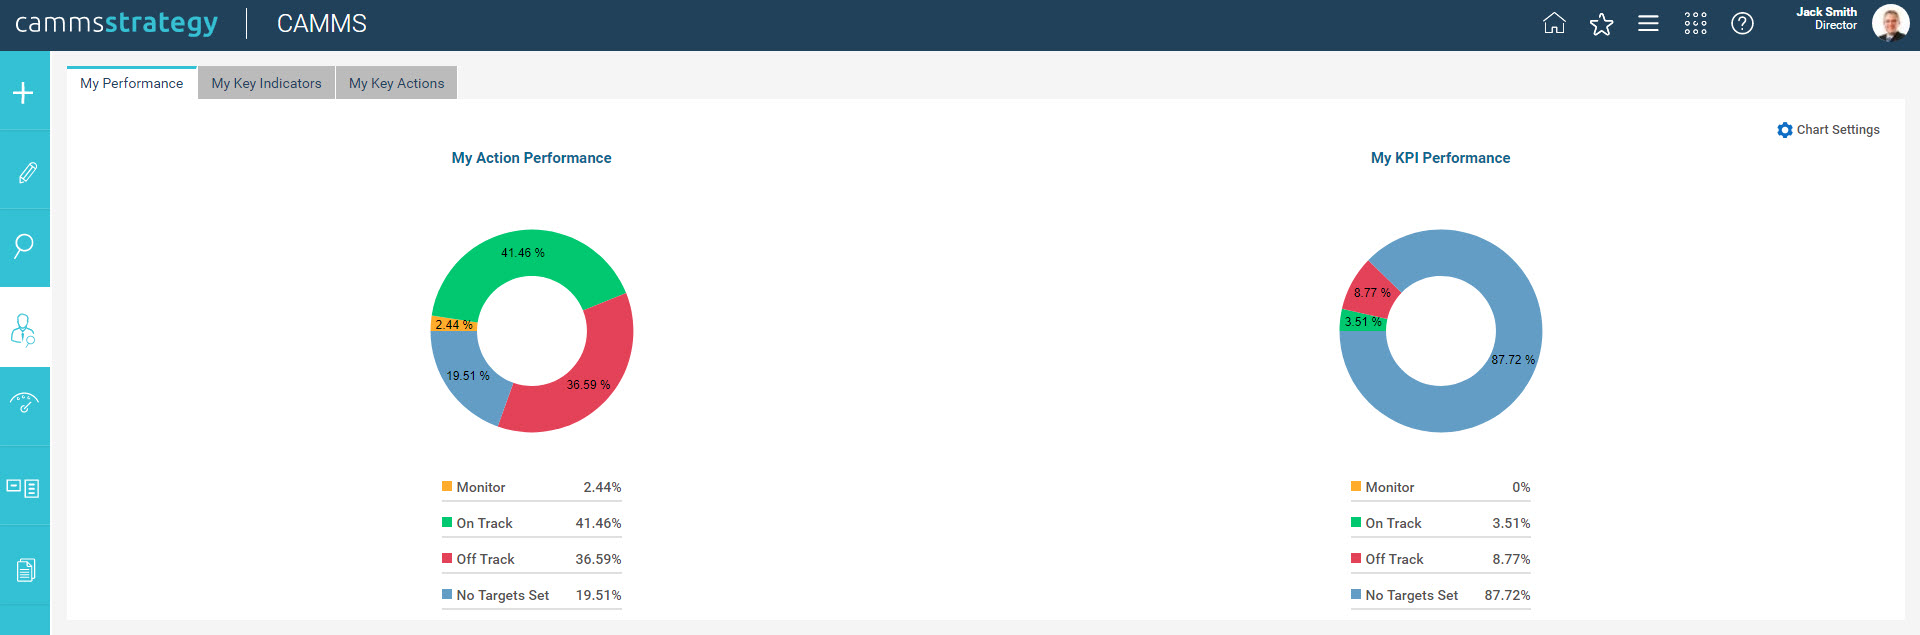
There are 3 main tabs of this interface:
My Performance
My Key Indicators
My Key Actions
Two donut charts would be displayed highlighting the performance of actions and KPIs belong to a particular responsible officer. Once you click on a coloured chart portion, an extended screen will be appeared beneath the screen depicting further information of actions/KPIs.
Following information is displayed against "My Action Performance" detailed view:
Following information is displayed against "My KPI Performance" detailed view:
A particular user can flag most critical KPIs from the list of KPIs which he/she is responsible for. Those KPI information would be illustrated via graphs against the period dimension. Actuals and Targets would be depicted against current fiscal year. A widget has following information regarding a KPI:
Using 'Widget Settings' area, you can select (simply drag & drop) the key indicators from the list of all KPIs.
A particular user can flag most critical actions from the list of KPIs which he/she is responsible for. Those action information would be illustrated via a grid; following information is depicted:
Using 'Widget Settings' area, you can select (simply drag & drop) the key actions from the list of all actions.
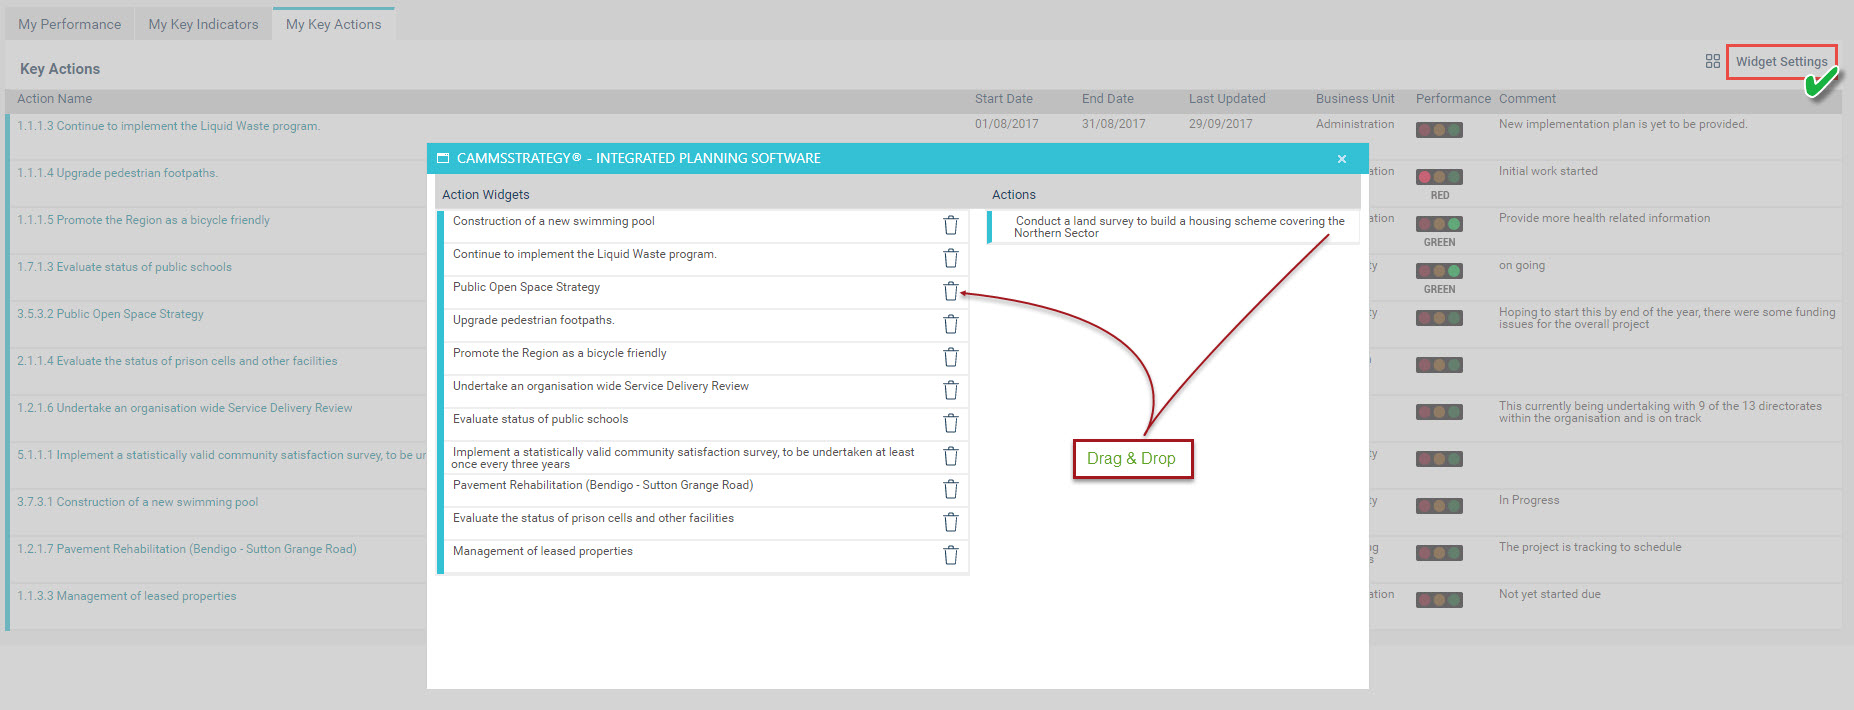
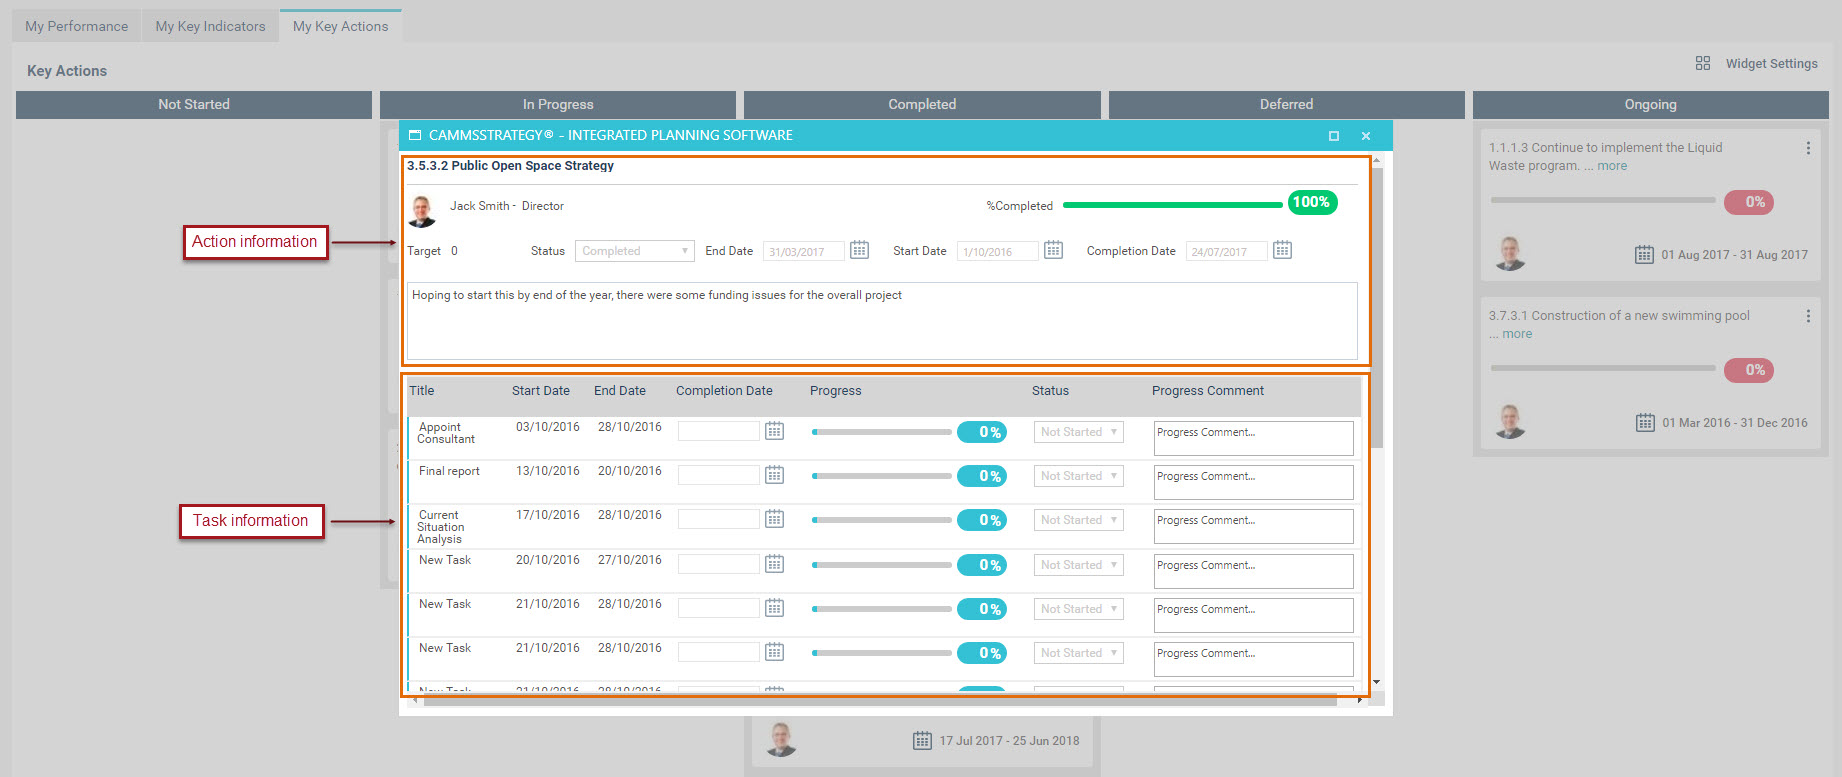
There are two views that end user can see the selected key actions:
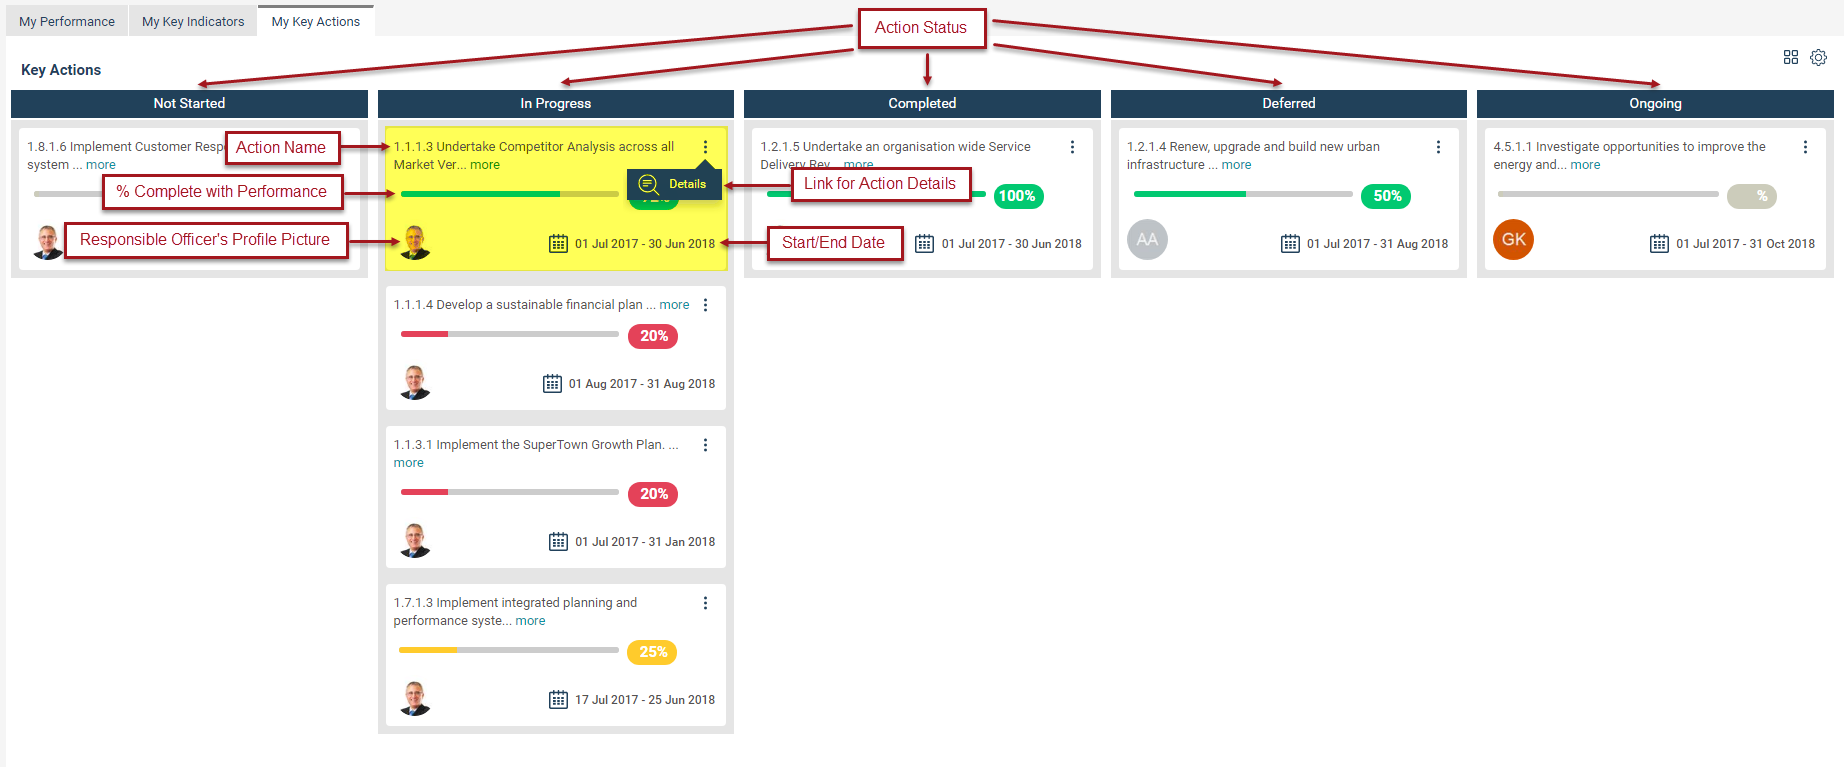
Kanban view further provides a detailed action and task view which is non-editable.
Copyright © 2014-2015 CAMMS Online Help. All rights reserved.
Last revised: November 26, 2017